Local Empirical Model of the E and F Region Ionosphere Based on 30
Years of Millstone Hill Incoherent Scatter Data
Introduction
Improved specifications and predictions of the ionosphere/thermosphere
system are an important objective of the National Space Weather
Program. As a contribution toward meeting this objective, we are
developing a series of empirical models of the average behavior and
variability of key parameters which characterize the
ionosphere/thermosphere system. Among these is a local model
of the E and F-regions above Millstone Hill. This model combines and
extends previous models of F-region density and temperature and
F-region ion drifts.
Data
The model is based on Millstone Hill data collected between 1970 and
2001, and archived in the Madrigal Database
(http://www.openmadrigal.org). The measured parameters are electron
density (Ne), ion temperature (Ti), electron temperature (Te) and
line-of-sight ion drift (Vi). Each measurement was passed through a
quality-control filter and the data which passed this filter were
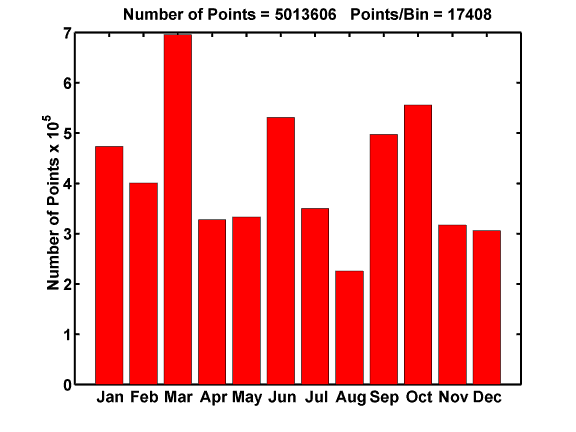
written to twelve ASCII flat files, one for each month. Altogether
there were 5,013,606 measurements, most of which included all four
parameters.

Data Distribution
The large volume of data used in each fit profile permits us to
investigate the distribution of the data about the fit. These can then
be used to validate the least-squares fitting and to provide an
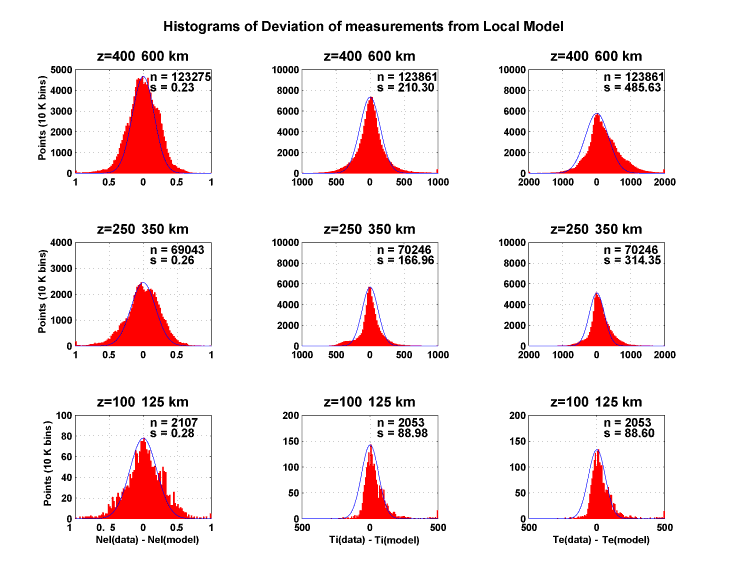
estimate of the model accuracy. The figure shows example distributions
for log10(Ne), Ti and Te in
three different altitude ranges. In addition to
the distribution histogram, each figure contains the number of points
in the distribution (n) and the standard deviation (\sigma). The solid
line is a Gaussian with the same standard deviation as the
distribution. Least squares yields the maximum likelihood estimate if
the data are Gaussian distributed, and this is seen to be a fairly good
assumption. In most cases the model estimate is quite close to the
histogram maximum likelihood value, even when the distribution deviates
noticeably from a Gaussian. Most distributions have larger wings than a
Gaussian, and Te is typically skewed toward larger values, particularly
at high attitudes The latter is a well-known consequence of the
non-linear and highly-correlated dependence of the incoherent scatter
spectrum on Ti and Te.

Model Formulation
The data were binned by month and local time in 1-hour increments.
Least squares fits for model parameter profiles were then computed in
each of the 288 bins. The model parameters are Nel (log10 electron
density), Ti, Te, Vi7 (geomagnetic-field-aligned upward ion velocity),
Vi8 (apex southward perpendicular velocity) and Vi9 (apex eastward
perpendicular velocity), where Nel etc are the CEDAR parameter mnemonic
for each parameter. The fitted profiles are piecewise-linear with
nodes at 100, 110, 120, 130, 140, 160, 180, 200, 225, 250, 300, 350,
400, 500, 600, 700 and 1000 km. The perpendicular velocity components
are assumed to be E×B drifts, and were held constant above 130 km. The
parameters are assumed to be linear in F10.7 for the previous day and
the Ap index for the previous 3 hour period.
The least squares fit yields a total of 4896 fit coefficients for Nel,
Ti, Te and vi7, and 1728 fit coefficients for Vi8 and Vi9. A 3×3
median filter in local time and season was then applied to these
coefficients. Finally, since Millstone Hill cannot make measurements in
the nighttime E-region, the daytime E-region data are fit with a diurnal
harmonic yielding interpolated model coefficients for the nighttime
E-region.
Virtual Millstone Hill Radar
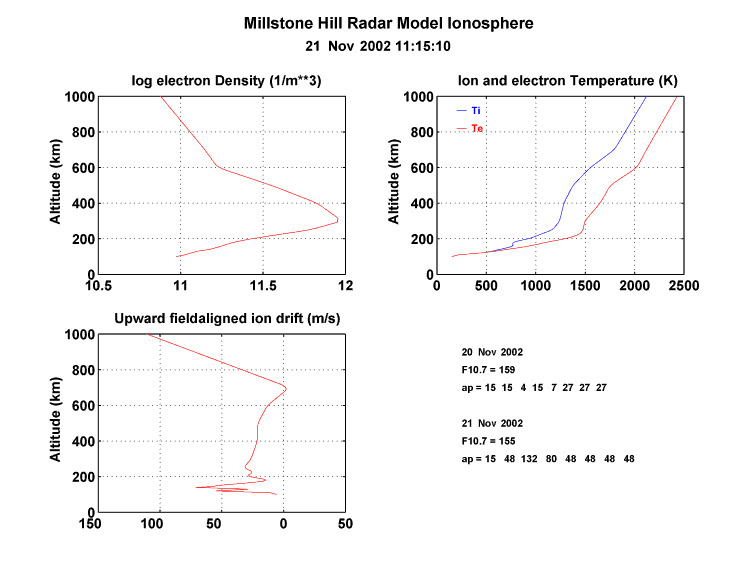
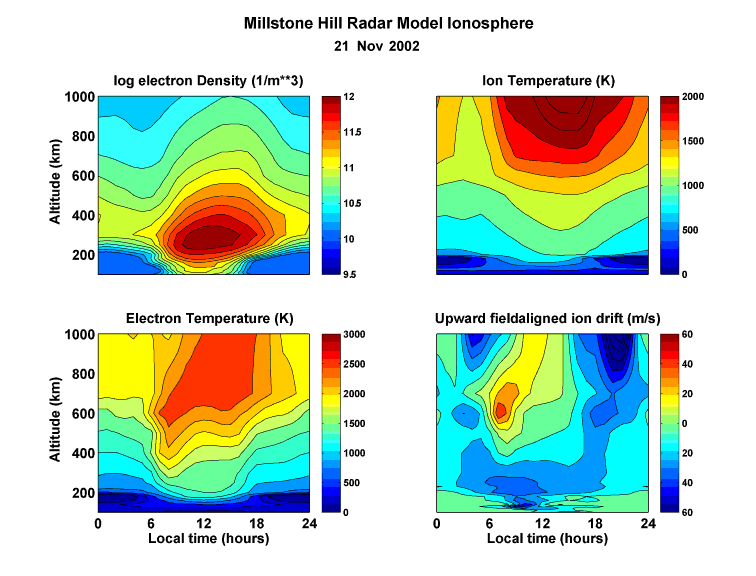
Millstone Hill local model plots for the current date, time and
geophysical conditions are available at
http://madrigal.haystack.mit.edu/models/vmhr/.
Regional model plots are also
available here. These plots are updated every 15 minutes. The models
are evaluated using recent measured and predicted values of F10.7 and
ap (or Ap for the local time vs altitude plot). When a measured value
of ap is not available, the last measured value is used.


Conclusions
A detailed empirical model of the E and F-region ionosphere above
Millstone Hill has been constructed. This model is based on more than
30 years of Millstone Hill ISR data. Detailed information on this and
other Millstone Hill empirical models is available at
http://madrigal.haystack.mit.edu/models/.
A Web-based interface for
running the models is also available, and the model coefficients and
Fortran software to recover model values from these coefficients can be
downloaded from this site.


